Web & AI Solutions For Your Startup
From robust cloud server deployment to full-stack web development and seamless AI & automation integration, our cost-effective, agile solutions allow you to focus on what really matters — your business.
Our Services
From web development to AI integration, Sianzzz Consultancy provides comprehensive solutions tailored to your business needs.
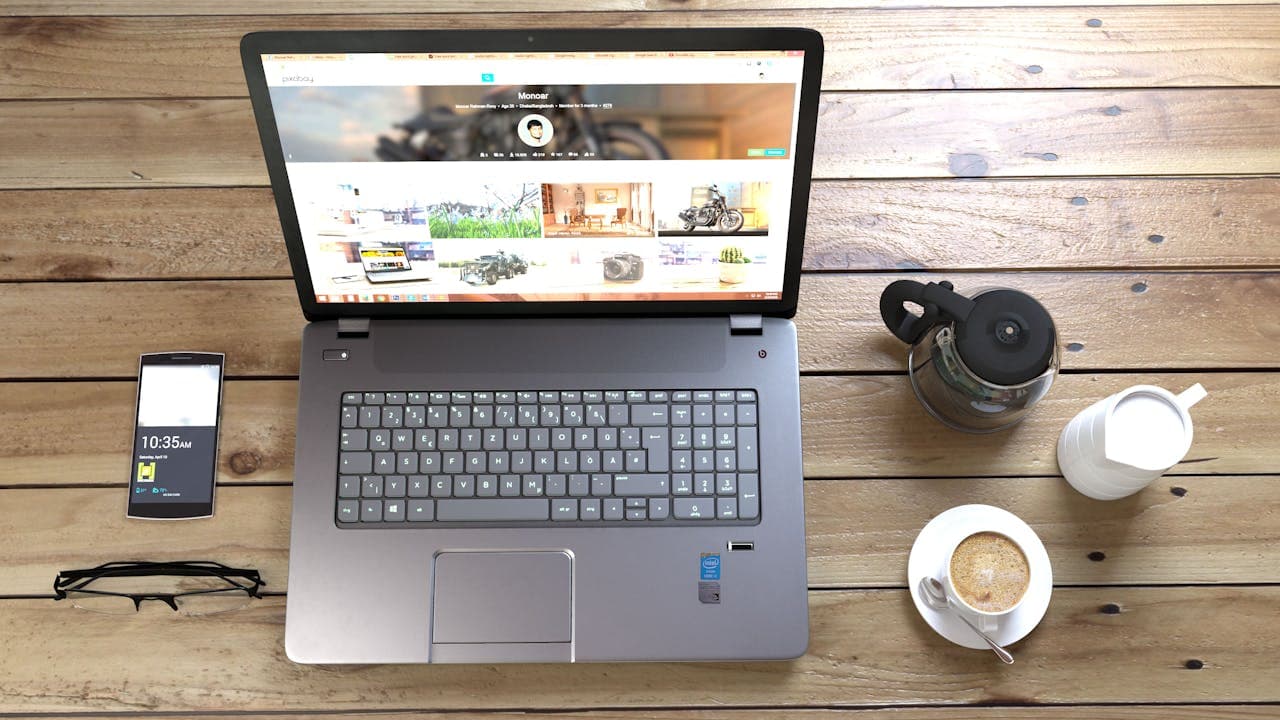
Full Stack Web Development
End-to-end web development solutions using cutting-edge technologies. From responsive frontends to scalable backends, we build robust applications.

I want to generate an image of two people, fighting outside a bar. They fight to the core. Once they're done, they sit down and drink beer.
Certainly, I'm generating this picture for you in a while. BTW are you talking about THAT movie?
I don't know what you're talking about.
Are you sure?
Yes, I'm sure. But if you're generating that scene, make sure the fighters have clown shoes and rubber chickens instead of fists!
Affirmative, here's your image.
Simple to Advanced AI chatbots
Custom AI chatbot solutions tailored to your needs. From basic customer service to complex enterprise applications, we help you automate conversations intelligently.
Best LLMs for your project
Whether it's OpenAI, GroQ or Your Mom's Basement LLM, we support everything.
Add LLM
Add
Groq LLM
23rd March
OpenAI GPT0
21st March
Stable DIffusion
3rd May
Llama 2
1st April
Claude 200k
2nd June
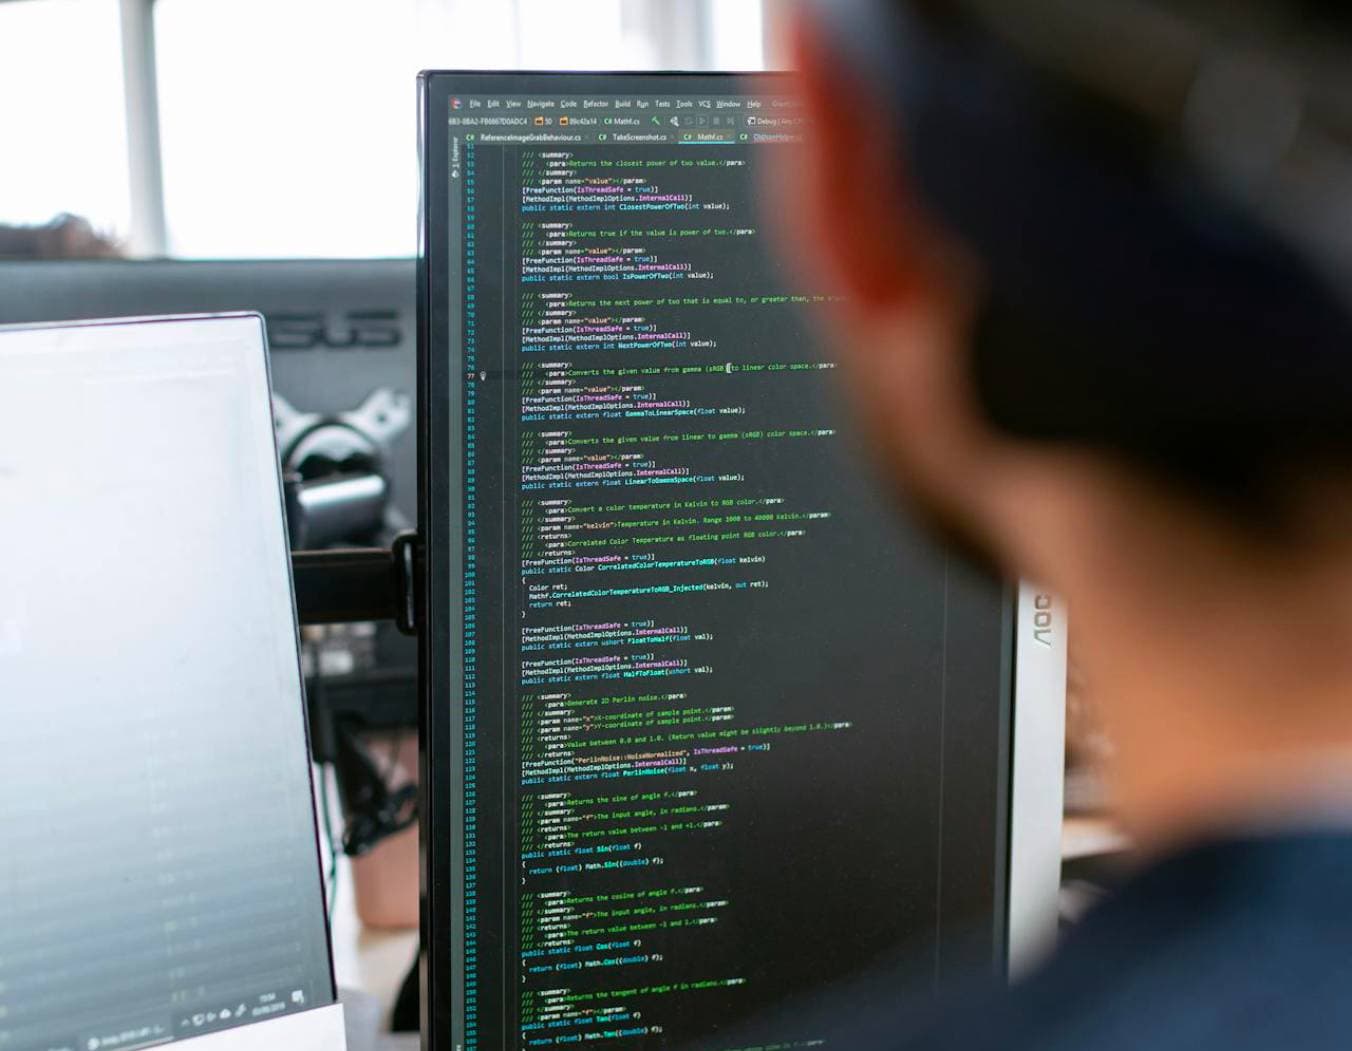
Live Deployment
Experience seamless deployment of your project to our state-of-the-art cloud infrastructure. Deploy and scale your applications with enterprise-grade reliability.
One-stop solution provider for startups and solopreneurs ... by solopreneurs (we know you)!
Long-term win-win partnership for sustainability and your business growth.
Solutions that won't break the bank. We deliver result without the ridiculous costs.
We build your project on robust state-of-the-art cloud architecture that ensure scalability.
Streamline your operations and maximize productivity with our efficient workflow solutions.
Get fast, friendly support whenever you need it.
Solutions crafted uniquely for your business goals.
Talk to us. Let us bring your business to the next level!
07-54 Paya Lebar Square
Singapore 409051
SIANZZZ CONSULTANCY