

For the uninitiated, DBS Group Holdings Ltd (SGX: D05), Oversea-Chinese Banking Corporation Limited (SGX: O39), and United Overseas Bank Ltd (SGX: U11) are three major listed banks in Singapore.
And they make up around 46% of Singapore’s stock market benchmark, the Straits Times Index (STI).
The trio of banks is popular among dividend investors here due to their growing dividends over the years.
In this article, let’s check out DBS, OCBC, and UOB from the perspective of their dividends.

TL;DR: DBS, OCBC & UOB Dividends

Jump to:
Earnings Growth
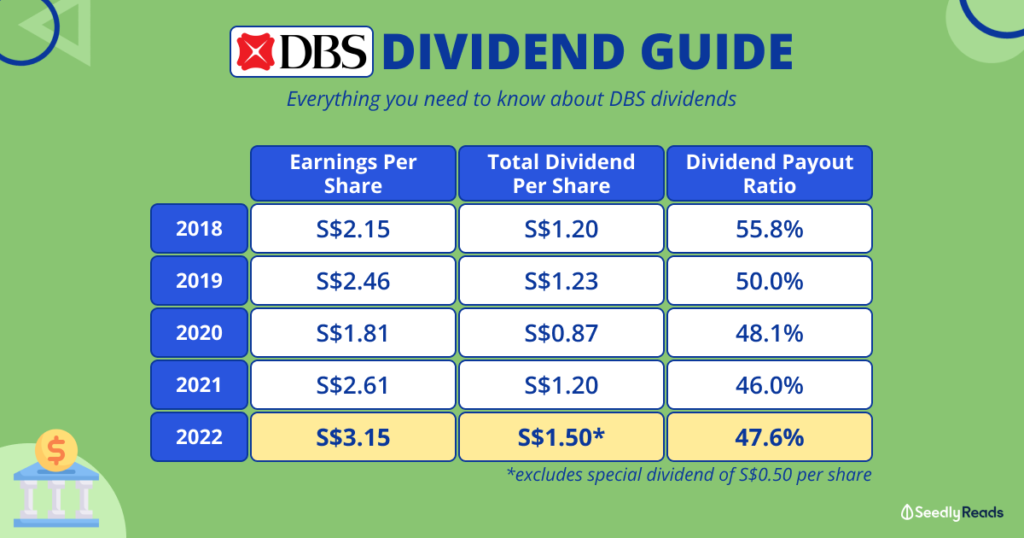
Firstly, let’s explore how the banks have grown their earnings over the last five years.
If a company can consistently grow its earnings, it means that it has a strong business.
It would also mean that it has the possibility of paying out higher dividends as its business grows over time.
The following table shows how DBS, OCBC, and UOB have grown their earnings per share from 2019 to 2023 (the banks have a 31 December year-end):
| Earnings Per Share (Year/Bank) |
DBS | OCBC | UOB |
|---|---|---|---|
| 2019 | S$2.46 | S$1.14 | S$2.55 |
| 2020 | S$1.81 | S$0.80 | S$1.69 |
| 2021 | S$2.61 | S$1.07 | S$2.39 |
| 2022 | S$3.15 | S$1.27 | S$2.69 |
| 2023 | S$3.87 | S$1.55 | S$3.34 |
We can see from the table that all three banks have seen strong growth in historical earnings, except for the fall in 2020 due to the pandemic.
With the banks’ increase in profits from 2019 to 2023, their dividends have climbed as well.
Dividend Growth
The next table reveals the dividend history of DBS, OCBC, and UOB.
| Dividend Per Share (Year/Bank) |
DBS | OCBC | UOB |
|---|---|---|---|
| 2019 | S$1.23 | S$0.53 | S$1.30 (includes special dividend of S$0.20; S$1.10 without) |
| 2020 | S$0.87 | S$0.318 | S$0.78 |
| 2021 | S$1.20 | S$0.53 | S$1.20 |
| 2022 | S$2.00 (includes special dividend of S$0.50; S$1.50 without) |
S$0.68 | S$1.35 |
| 2023 | S$1.92 | S$0.82 | S$1.70 |
| Compound annual growth rate (CAGR) |
9.31% | 7.17% | 5.51% |
DBS has increased its dividends the most from 2019 to 2023 to the tune of around 9.31% per annum.
For 2020, all three banks had to curb their dividends as a pre-emptive measure by the Monetary Authority of Singapore (MAS).
However, MAS lifted the dividend restriction in July 2021 and all three banks have reinstated their dividends since then.
Here’s a look at the banks’ dividend history:
| Year | Dividend Period | DBS Dividend Per Share (Singapore Cents) | Total Dividend for the Year (Excluding Special Dividend) | OCBC Dividend Per Share (Singapore Cents) | Total Dividend for the Year (Excluding Special Dividend) | UOB Dividend Per Share (Singapore Cents) | Total Dividend for the Year (Excluding Special Dividend) |
|---|---|---|---|---|---|---|---|
| 2019 | 1Q interim dividend | 30 | 123 | – | 53 | – | 130 |
| 2Q/1H interim dividend | 30 | 25 | 55 | ||||
| 3Q interim dividend | 30 | – | – | ||||
| Special dividend | – | – | 20 | ||||
| Final dividend | 33 | 28 | 55 | ||||
| 2020 | 1Q interim dividend | 33 | 87 | – | 31.8 | – | 78 |
| 2Q/1H interim dividend | 18 | 15.9 | 39 | ||||
| 3Q interim dividend | 18 | – | – | ||||
| Final dividend | 18 | 15.9 | 39 | ||||
| 2021 | 1Q interim dividend | 18 | 120 | – | 53 | – | 120 |
| 2Q/1H interim dividend | 33 | 25 | 60 | ||||
| 3Q interim dividend | 33 | – | – | ||||
| Final dividend | 36 | 28 | 60 | ||||
| 2022 | 1Q interim dividend | 36 | 200 | – | 68 | – | 135 |
| 2Q/1H interim dividend | 36 | 28 | 60 | ||||
| 3Q interim dividend | 36 | – | – | ||||
| Special dividend | 50 | – | – | ||||
| Final dividend | 42 | 40 | 75 | ||||
| 2023 | 1Q interim dividend | 42 | 192 | – | 82 | – | 170 |
| 2Q/1H interim dividend | 48 | 40 | 85 | ||||
| 3Q interim dividend | 48 | – | – | ||||
| 4Q final dividend | 54 | 42 | 85 |
Frequency of Dividend Payments
DBS’ dividend is currently broken down into four different payouts. Since the first quarter of 2019, it has been declaring dividends every three months.
DBS said in its 2019 first-quarter earnings that it would start paying quarterly dividends to provide “shareholders with more regular income streams”, instead of biannually as was the case previously.
DBS’ peers, OCBC and UOB, still pay dividends half-yearly.
Dividend Payout Ratio
The dividend payout ratio tells investors what percentage of a company’s earnings are paid out yearly as a dividend.
Any ratio below 100% means that the company is paying dividends sustainably.
Let’s see how sustainable dividends from DBS, OCBC, and UOB are by examining their dividend payout ratios:
| Dividend Payout Ratio (Year/Bank) |
DBS | OCBC | UOB |
|---|---|---|---|
| 2019 | 50.0% | 46.5% | 43.1% (51.0% if special dividend is factored in) |
| 2020 | 48.1% | 39.8% | 46.2% |
| 2021 | 46.0% | 49.5% | 50.2% |
| 2022 | 47.6% (63.4% if special dividend is factored in) | 53.5% | 50.4% |
| 2023 | 50.9% | 52.9% | 50.9% |
As seen from the table above, including special dividends, all three banks have been paying out less than 100% of their earnings as dividends.
Dividend Guidance
DBS is the only local bank that has guided its dividend.
It has a dividend policy of paying “sustainable dividends that grow progressively with earnings”. But it doesn’t have a specific dividend payout ratio, unlike some other listed companies.
Latest Dividend Yield
Of the three banks, DBS has the highest dividend yield at the time of writing, followed by OCBC and UOB.
| DBS | OCBC | UOB | |
|---|---|---|---|
| Share price | S$33.58 | S$13.11 | S$28.29 |
| Dividend Yield for FY2023 | S$1.92 | S$0.82 | S$1.70 |
| Dividend yield (forward) | 6.43% | 6.38% | 6.01% |
Read More:
Going Deeper into the Banks’ Dividends
If you wish to find out even more about the banks’ dividends, do check out our separate dividend guides for DBS, OCBC, and UOB!
For DBS ????
For OCBC ????

For UOB ????

Disclaimer: The information provided by Seedly serves as an educational piece and is not intended to be personalised investment advice. Readers should always do their own due diligence and consider their financial goals before investing in any stock. The writer doesn’t own shares in any companies mentioned.